
The numbers that matter most.
Beautiful dashboards that turn your practice data into clear, actionable insights. Track appointments, revenue, client retention, and growth trends, all in real time.
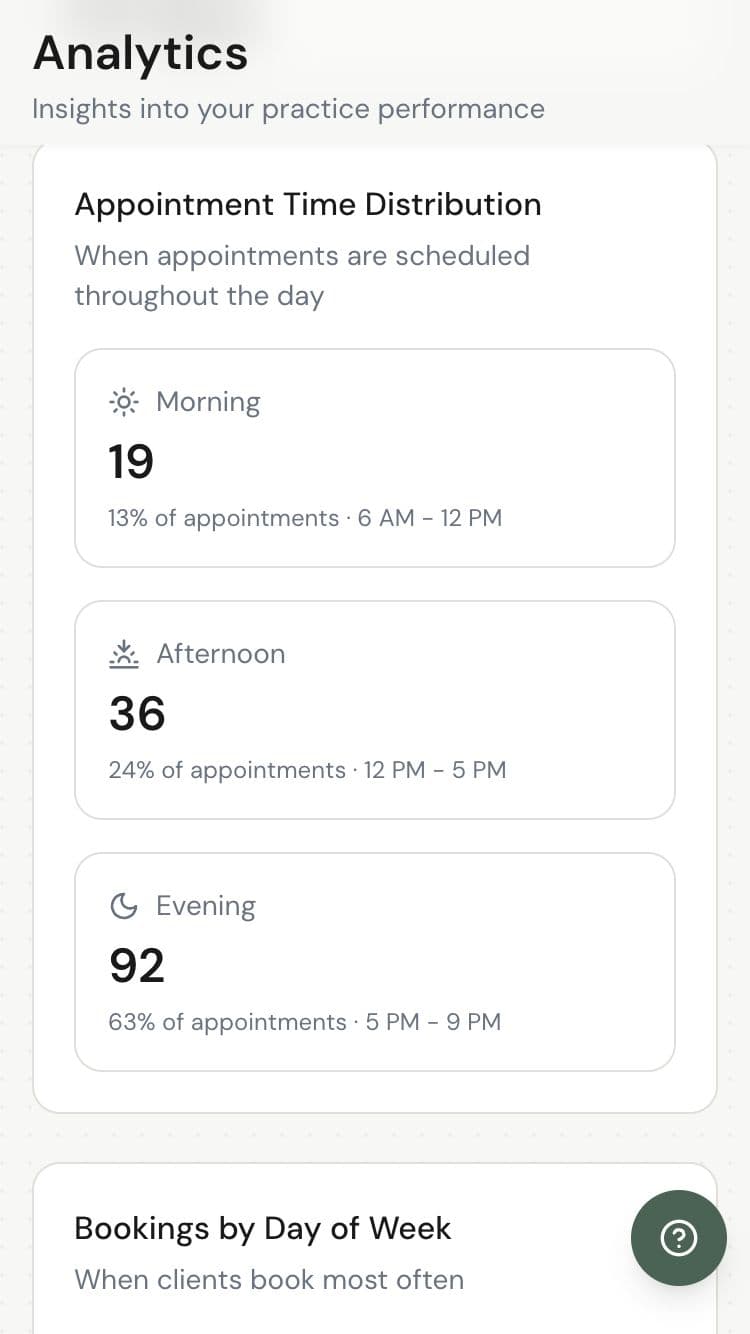
A short film without narration; its words are on screen. A practice's analytics: bookings by day of the week build up one appointment at a time, then the totals (59 appointments, 38 active clients), how the day splits into morning, afternoon and evening, and which services lead. Narrowing the dates to one week updates every view, and Friday turns out to be the busiest day.

Trends that tell
a story.
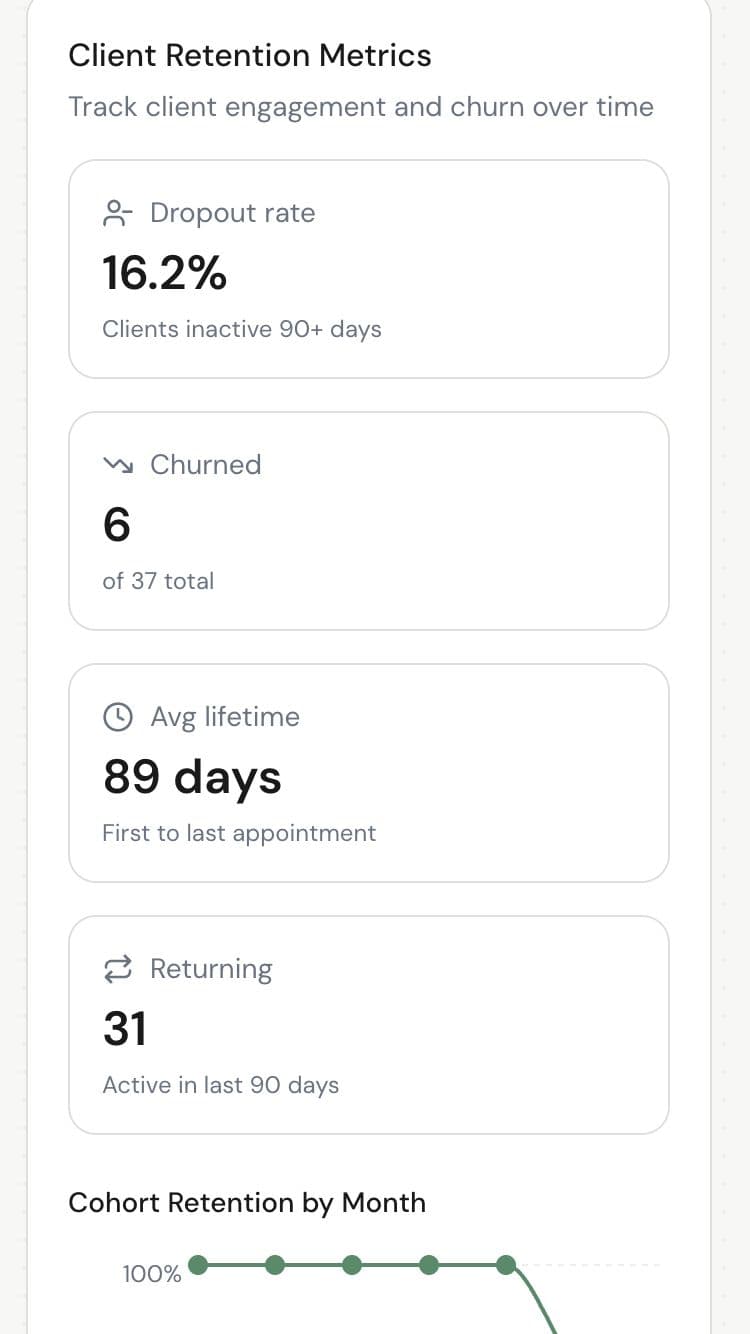
See how your practice is growing over time. Appointment volume, revenue trends, and booking patterns are visualized in clean charts. Spot seasonal trends and plan accordingly.
Growth tracking
Monitor appointment volume, new clients, and booking patterns month over month.
Client insights
See where clients come from, which services are popular, and how often they return.
Visual charts
Clean, simple visualizations that surface the data you actually need.
Revenue, tracked
and forecasted.
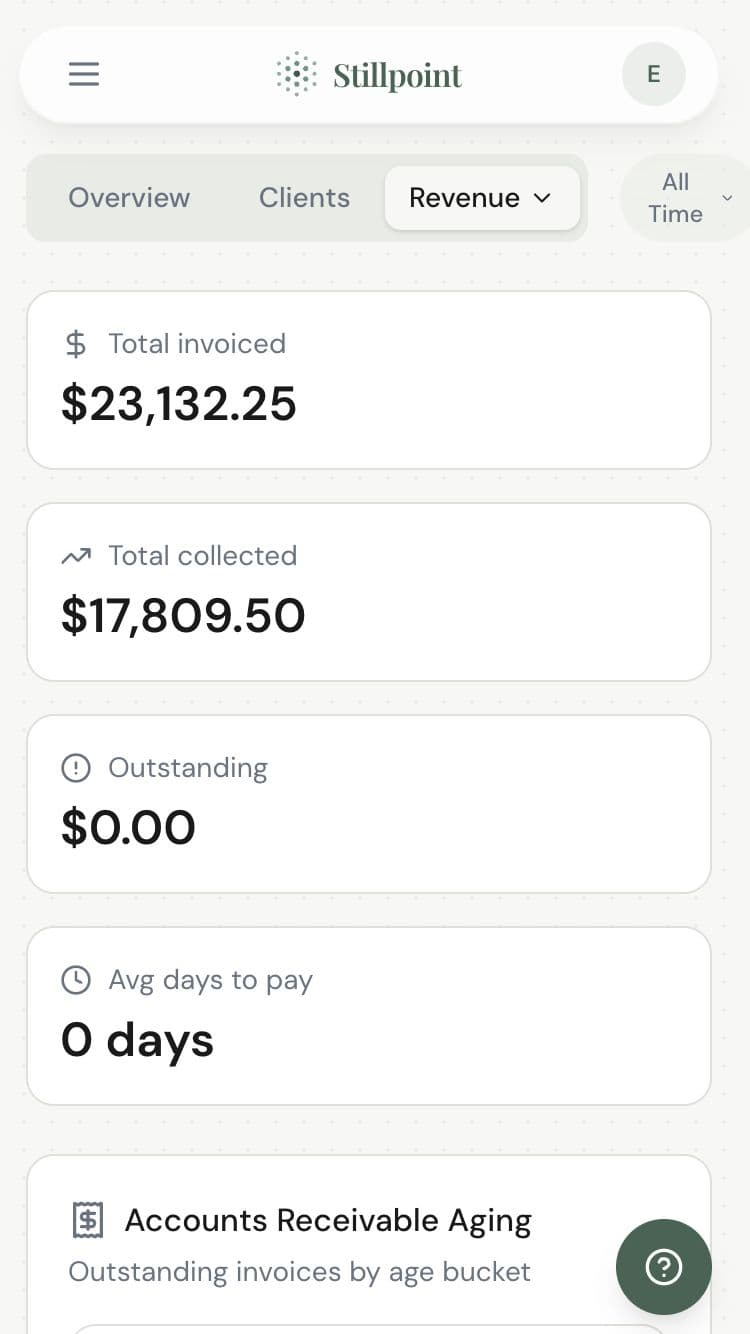
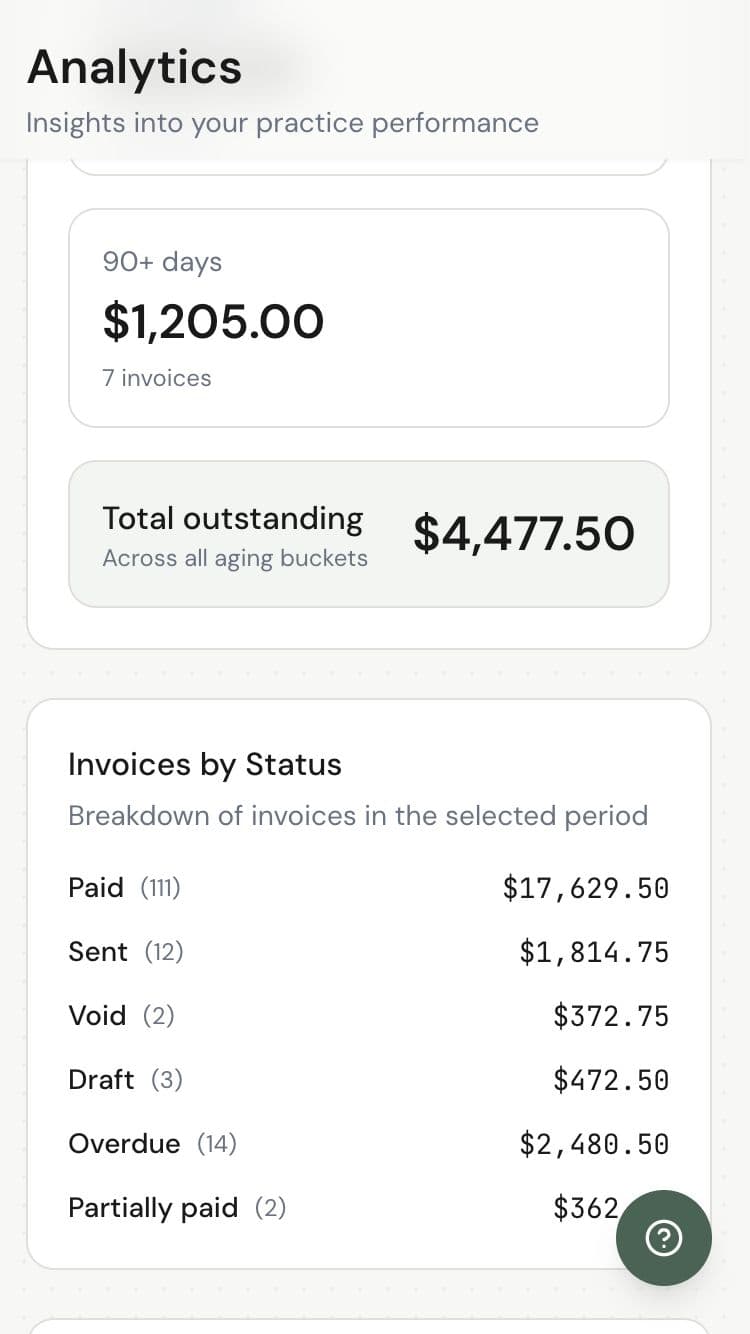
Track revenue by service, practitioner, or time period. See outstanding invoices, payment trends, and monthly comparisons. Everything you need to make informed business decisions.
Revenue by service
Break down earnings by service type to see what drives your practice.
Practitioner comparison
Compare revenue across team members to balance workload and growth.
Monthly trends
Track month-over-month changes with clear visual comparisons.
Ready when you are.
Join wellness practitioners who use Stillpoint to fill their schedule and focus on what matters most.
Start Free© 2026 Stillpoint